

Great execution is a result of great preparation. As the weather in Seattle gets warmer, our opportunities to experiment with the car are expanding. With spring break around the corner, we are arranging to test the car in anticipation of the race this summer. Before going to Texas in July, it’s vital that the team collects test data and utilizes it to optimize the car’s performance and efficiency. We do this by completing several trials on a practice track or parking lot and recording live data points from the car as it drives. We collect data on each parameter we need to know (or think we need to know) during the real race, ranging from motor temperature and solar amperage to power draw and the status of our cruise control. We also test our ‘periphery systems’, such as the radios and supplemental battery system to ensure every aspect of the car works smoothly. One malfunction could cost us first place, so inspecting each and every detail is the key to success.
The first step in testing the car is deciding what we want to test. Currently, our Arduino code sends more than forty unique parameters from the car’s management system to our MySQL, the telemetry system’s storage platform. As you can imagine, trying to analyze data from forty parameters would be very time consuming, not to mention unnecessary since only some bear importance in this stage of constructing the car. To keep ourselves focused on what matters most, we reduced the figure of forty to just eleven. As of now, the major parameters we plan on recording include battery percentage, amps, distance, and of course, time.
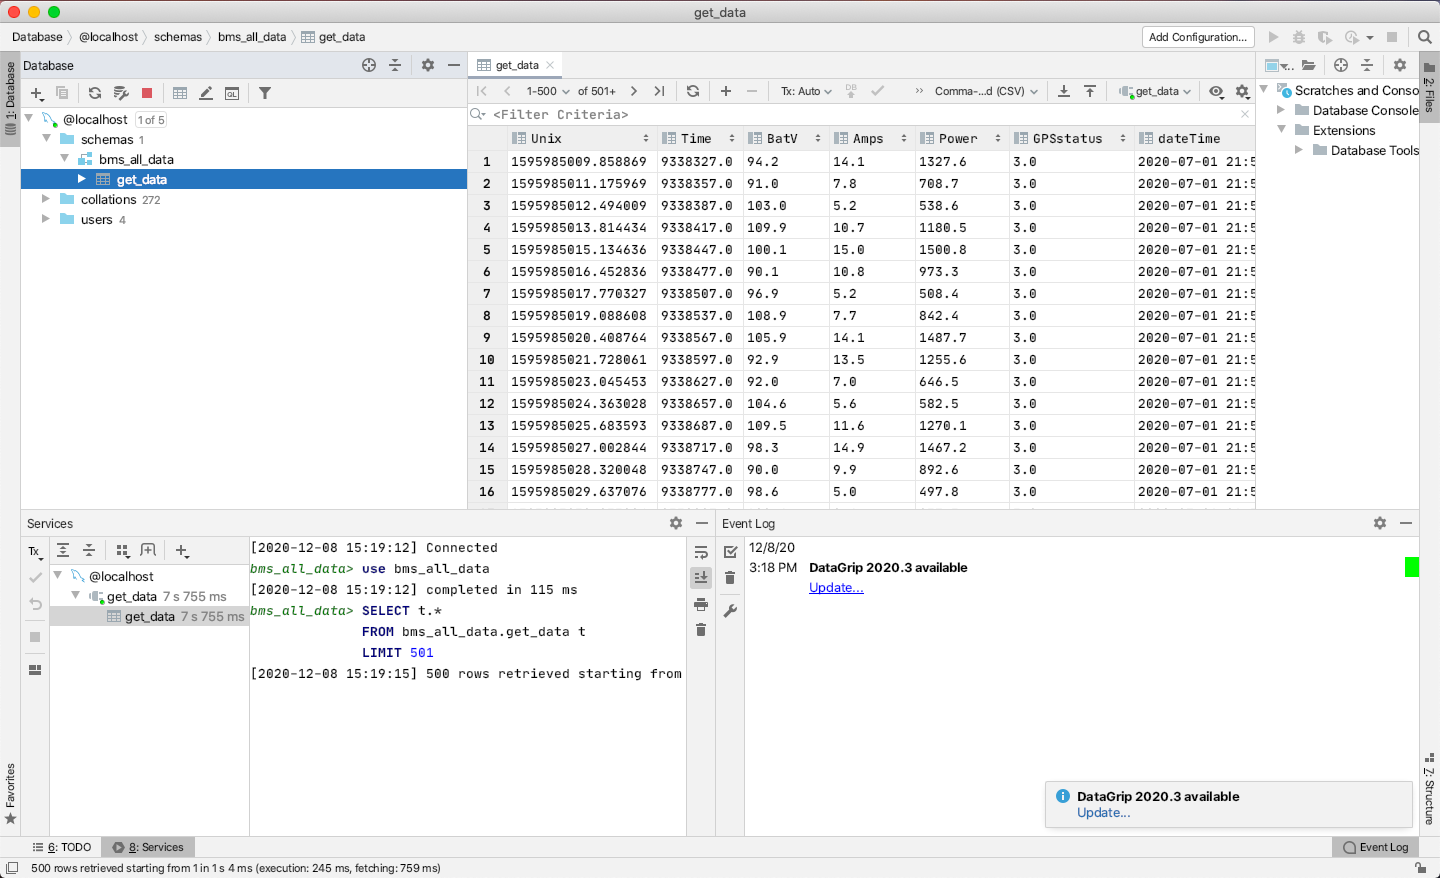
You might be wondering what “ordering the parameters” refers to. Well, once we drive the car around, we send the data to our MySQL database. MySQL acts as a storage platform for our hundreds of lines of data; the code sends out info every second. MySQL takes all the data points it receives and formats them into columns and rows within tables. However, that is not the only purpose of MySQL. As you can see below, it’s quite overwhelming to look at multiple columns, each with 500 lines, and understand what each one means. During the race, it’s hard to communicate to the driver how to adjust their speed, cruise control, braking, etc. when all we see is a list of decimals.
This is why we use MySQL as a waystation between the car and an online visualization website called Grafana. Using Grafana, data is displayed in a legible and aesthetically pleasing manner. Grafana pulls figures from MySQL and turns them into easy-to-read graphs, gauges, bar charts, maps, and buttons which constantly update every second to give us the most up to date information possible. We can look back at graphs after driving the car to see what needs to be improved, and they are also a great tool at our disposal during the live race, as they constantly update to show the energy being used by the car, the battery percentage, and several other crucial stats.
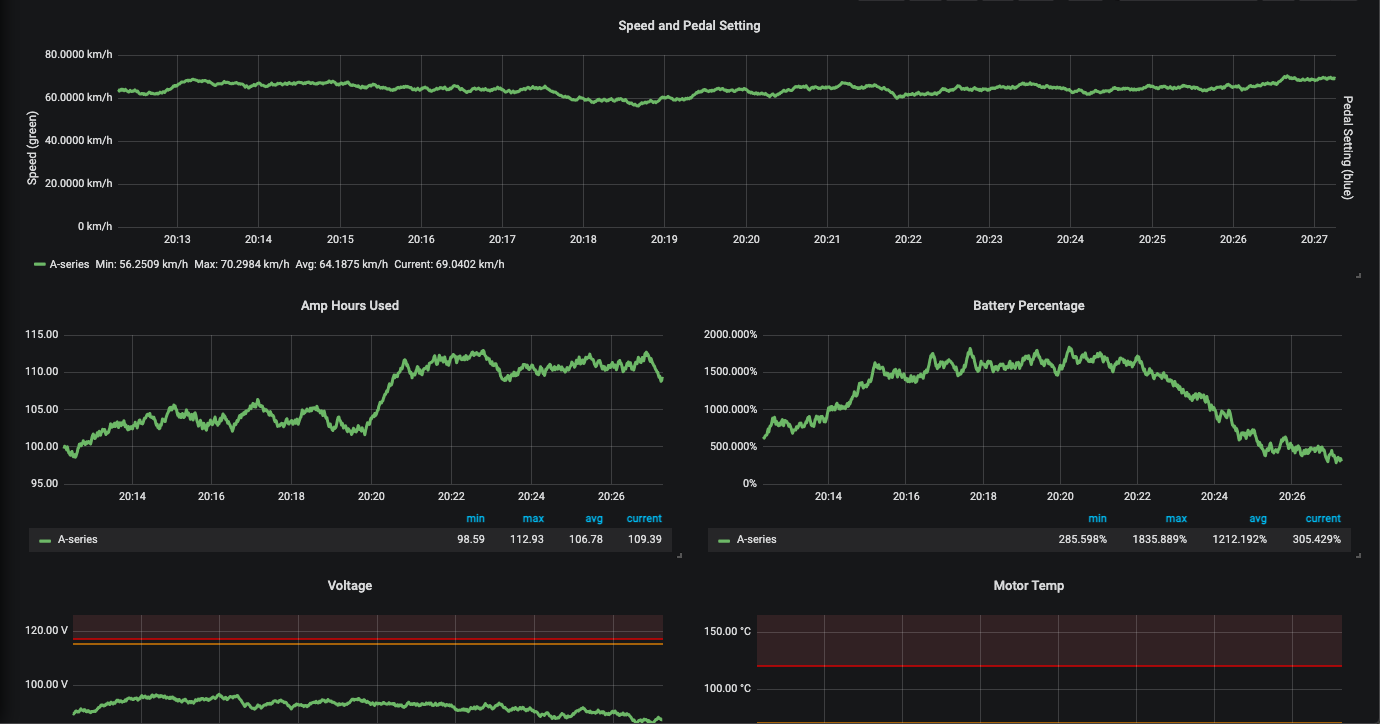
Analyzing these graphs after our test will not only show us how our motor temperature and battery percentage are impacted over time, but we will also see how power draw varies at different speed intervals, whether one or two motors is more efficient, and our total efficiency. Testing will provide us with an abundance of insights into how our car performs, as well as its strong points and drawbacks. Stay tuned to hear how it goes!
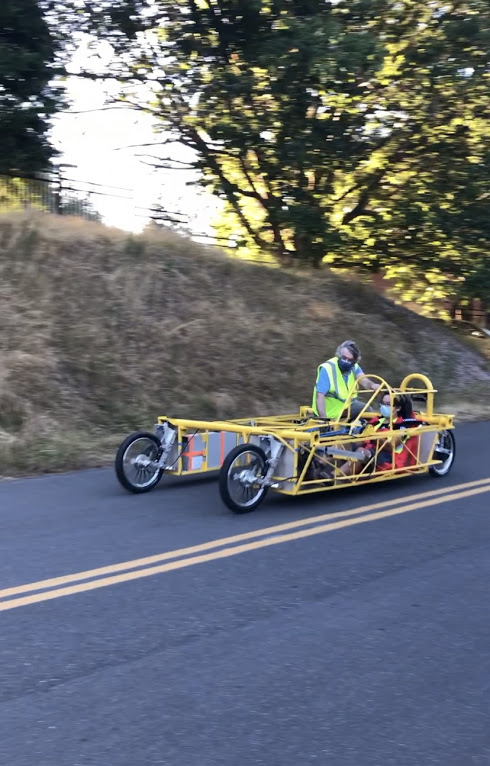
Woohoo! Looks like fun!